Plasticity of Reproductive Behaviour in Wood Bison Bulls: When Subadults are Given a Chance
P.E. KOMERS, F. MESSIER and C.C. GATES
Department of Biology, University of Saskatchewan, Saskatoon, Saskatchewan, SlN OWO, Canada
Reprinted from Ethology, Ecology, and Evolution. 6:313-350, 1994
Received 10 May 1993, accepted 24 January 1994
Abstract
In animals that defer reproduction until after physiological maturity because of competition by older individuals, one would expect that individuals reproduce earlier when competition decreases. We investigated nine behaviours relevant to reproduction in subadult wood bison males in captivity where mature males have been experimentally removed and compared them to males in a control and a free ranging population. Free-ranging males fed less and walked more with increasing age. Mature males had more back-fat than subadults and they lost most of their fat during the rut. In the captive population, subadults in absence of mature males tended to feed less and were involved in more sexual and aggressive interactions than subadults in a control situation. They significantly increased feeding time from rut to late-rut, while in the control situation neither subadults nor mature males changed. However, the population's age-structure did not affect the pattern of subadults associating with cows, nor did it affect the length of tending bouts by subadults. Our results suggest that subadults can alter some reproductive behaviours depending on the social environment, but without taking on the role of mature males. The finding that some behaviours vary with the social environment while others do not has two implications for studies on reproductive behaviour: (i) researchers are advised to consider potential effects of the age-structure on observed behaviour. and (ii) the kinds of behaviours chosen to study should be considered relative to the potential effects of the age-structure.
Many animals postpone reproduction until after physiological maturity if the risks associated with competing for reproductive opportunities are high. Adopting this strategy (sensu DUNBAR 1982) presumably increases reproductive gains later in life through increasing size, improving competitive ability, or experience (STEARNS 1976, RUBENSTEIN 1980). Consequently, young animals may trade current reproduction for growth until their size and/or competitive ability reached a level at which investment in reproduction should be favoured over investment in growth or maintenance (KIRKWOOD & ROSE 1991, KOZLOWSKI 1991, PERRINS 1991). STEARNS (1976) raised the fundamental point that populations are unstable in their age-structure due to population increase or decline. Thus, age at first reproduction may differ depending on the social environment and the degree of competition (STEARNS 1976, RUBENSTEIN 1980). This argument implies that individuals are able to assess the current trade-offs between reproduction (energy expenditure) and growth (energy retention).
However, theories addressing the evolution of age-specific reproductive behaviour suggest that there is a genetic basis for the age at first reproduction (PIANKA & PARKER 1975, CHARLESWORTH & LEON 1976, CASWELL 1982). If so, then behaviour should be relatively invariant under different conditions. If not, then age at first reproduction is simply a function of access to mating partners which may be influenced by the age-structure of the population. In this case, reproductive behaviours would represent a high degree of phenotypic plasticity (PARTRIDGE & HARVEY 1988).
In order to understand evolutionary mechanisms of age-specific reproductive behaviour, its degree of plasticity must be determined before focusing on those variables that may be useful for the study. Knowledge of the relationships between age-structure and reproductive behaviour is important because age-structure of populations may vary a great deal, either because of natural population fluctuations or because of human activities, such as harvest or habitat destruction. In either case, subadult males are likely to belong to the most affected age-class because they are usually physiologically mature but are generally believed to be excluded from reproduction by older, more competitive males (GEIST 1971, CLUTTON-BROCK et al. 1982). Furthermore, because of their participation in breeding, mature males suffer a higher mortality outside of the breeding season than younger ones (LEBOEUF 1974, CLUTTON-BROCK et al. 1982). In the present study, we focused on reproductive behaviour of subadult male wood bison (Bison bison athabascae, following the nomenclature of VAN ZYLL DE JONG 1986) in populations of different age-structure.
In this first of two sequential papers, we investigate nine variables of reproductive behaviour in wood bison, in an attempt to determine those that can be adapted to the current social environment, and those that are relatively invariant. Our list includes some of those that are commonly used in describing reproductive behaviour in ungulates (GEIST 1971, CLUTTON-BROCK et al. 1982, SHACKELTON 1991), but it is not intended to exhaust all possible measurements. In a sequential paper(KOMERS et al. 1994) we will focus on one of these variables, aggression, and investigate its usefulness in understanding age-specific reproductive tactics.
Wood bison males participate increasingly in rutting activity with increasing age (KOMERS et al. 1992). Older males are more often solitary than younger ones, but when they enter cow groups older males are involved in more sexual and aggressive behaviour, and are more successful in gaining access to females. Each male usually defends one female at a time, resulting in a tending pair (LOTT 1974, KOMERS et al. 1992). In this study, we first report on reproductive behaviour of males of different ages in a free-ranging population, and then compare it to behaviour observed in two captive populations, in one of which mature bulls were experimentally removed.
Study Area and Methods
The study was conducted in two parts. In 1989 and 1990, we observed a free-ranging wood bison population in the Mackenzie Bison Sanctuary (MBS), Northwest Territories, Canada ( 61o 30'N , 117000'W). In 1991, we observed a captive population at the Waterhen Wood Bison Ranch (WBR), Manitoba, Canada (52o00'N, 99o20'W).
The Mackenzie Bison Sanctuary - The site and the animals
During this study, the population was estimated at 2040 wood bison (GATES et al. 1991). No fences restrict the movements of bison. Details on habitat and study site are given by KOMERS et al. (1992). We observed bison in open habitats, and made no effort to observe in the forest.
The study in the MBS was carried out from May 19 to September 30, 1989, and from April 19 to October 15, 1990. Both observation years were divided into periods: pre-rut (May 20 to June 30), rut (July 16 to August 31), late-rut (September 1 to 30), autumn (October 1 to 15). Late-rut represents the same time period as "post-rut" in an earlier study (KOMERS et al. 1992). However, because some rutting activities are still in progress, the term "post" is not strictly appropriate.
Preliminary observations revealed that marked individuals (n = 70) ranged widely throughout the MBS. There was a high turnover of individual bison at Falaise Lake (C.C. GATES unpublished data), suggesting that our observations included the majority of individuals in the population, not only a geographically restricted sample.
We searched the study area for bison daily, using all-terrain vehicles. Behaviour was recorded only from groups containing three or more individuals. When we spotted a bison group at a distance (usually > 150 m), we left the vehicles behind and approached the animals on foot. By hiding in the vegetation, we made an effort not to be detected by the animals. Bison which detected humans generally left the area immediately. Therefore, we believe that the behavioral data were not affected by the presence of observers.
We observed bison during daylight hours (05:00-23:00 hr). One to three observers used binoculars and telescopes to observe specific bison groups for 1 to 3 hr. Overall, 318 groups were observed during the study, so that each of the observers recorded behaviour during approximately 600 hr.
We determined age- and sex-classes of bison. Hereafter, we refer to young bulls as Bl, subadult bulls as B2, adult bulls as B3, and old bulls as B4. The ages of bulls presented were determined by cementum annuli counts in one incisor (LAWS 1952), based on a sample of 56 bulls, which were independently visually aged (Bl to B4).
Table 1
Definitions of age- and sex-classes for wood bison
|
Age- and sex-class |
Definition |
|
Calves |
Young of the year of both sexes |
|
Yearlings |
Animals of both sexes with spike-shaped horns (10-20 cm length), smaller than cows (less than 2 yrs. old) |
|
Young bulls (B1) |
About the size of cows or smaller, hair on head and chest relatively short. Base of horns wider than in cows, horns pointing outward or upwards, never curved to point towards each other (1-3 yr. old) |
|
Subadult bulls (B2) |
Size range between the size of cows and adult bulls. Hair on head and chest shorter than in adult bulls, horns point straight up or may curve towards the middle line of the skull. Base of horns wider than in cows but the horns distinctly extend above the top of the head. Hair on forehead short, leaving the space between horns open, but a forelock may be formed (3-6 yr. old). |
|
Adult bulls (B3) |
Size larger than cows. Hair on chest and head fully developed, leaving no open space between the horns. Horns curved towards the middle line of the skull (6-12 yr. old) |
|
Old bulls (B4) |
General appearance like adult bulls, but tips of horns are chafed off (10-16 yr. old) |
|
Cows |
Horns thinner than that of any male. Horns curved toward the middle line of the skull, may be curved towards the back forming an s-shape in older cows (age classes of cows are difficult to separate and were not recorded in this study). The front of the skull narrower than that of adult bulls. |
The behaviours recorded
To investigate the proportion of time spent grazing and walking. we applied the instantaneous scan method (ALTMANN 1974). For each individual, we recorded at 15-min intervals whether it was grazing (standing or walking with mouth touching vegetation) walking (mouth not touching vegetation), or involved in other activities. The behaviour recorded was the one which the individual exhibited at the instant its age and sex were determined. The average frequency of behaviour per scan was calculated for each age-class in each group as:
(Σsx¡/bx)/N
where Sxi is the number of times bulls of age-class x in the ith scan performed behaviour s, and bxi is the number of bulls of age-class x observed in the ith scan. N is the number of scans. A minimum of three and a maximum of 12 scans was recorded for each group. An effort was made to scan most groups 8 times. Spring behavioural data are omitted because most breeding activities occurred between July and September.
Because of the difficulty of obtaining data from focal animals, we concentrated on the instantaneous scan sampling described above. However, this method could include biases through, for example, a better visibility of mature males when they walk, which may overestimate the time spent walking by mature males. Therefore, we also recorded the proportion of time spent walking and grazing from focal B2's and B3's during the rut. Only marked individuals were observed during 5 to 9.5 hr, each in a different group. The time during which focal animals were temporarily out of sight was not considered in the analysis.
During the rut and late-rut, the distance covered by focal B2's, B3's, and B4's was monitored by counting the number of steps during intervals lasting 3 to 20 min. Distances covered by bulls were recorded only if focal animals walked during more than 50% of the focus observation and if more than 50% of all members of a group were not lying. This restriction was required because the activity of focal animals could be reduced if most of the animals in a group were lying.
Morphological measurements
Back-fat depth was recorded on animals immobilized with carfentanil (KOCK & BERGER 1987), using a Scanmatic ultrasound back-fat measurer. The accuracy of the back-fat measurer was examined on 12 cattle by comparing the readings on live animals to measurements taken by a ruler from the same animals after slaughter. The two methods differed by a maximum of I mm. The anatomical site selected was 20 cm cranio-ventrally from the tail base, so that the gluteo-biceps was the underlying muscle. This site has been found to be correlated with overall body fat in wood bison (C.C. GATES unpublished data). Back-fat measurements were obtained only from B2's and B3's during pre-rut and late-rut.
Scrotal circumference, a measure of fertility (WILLET & OHMS 1957, HAHN et al. 1969), was measured with a fabric measuring tape at the widest circumference of the scrotum. We measured scrotal circumference on immobilized B2's, B3's, and B4's. In addition, we measured the girth (body circumference measured at the highest point of the hump and posterior of the fore limbs) and the length (from edge of fur at the nose to tail base, following the dorsal contour of the animal).
The Waterhen Wood Bison Ranch - The site and the animals
The WBR was a fenced area of 8 x 5 km. The fence was 2 m high and consisted of wire mesh. The ranch was divided into two parts by a similar fence. In addition, one strand of electrical fence (cattle guard) on either side of this dividing fence prevented animals from damaging it. The area north of the dividing fence extended over 5 x 3 km, the southern area over 5 x 5 km. Hereafter, we call the northern area the experimental side, the southern area the control side.
The habitat was similar on both sides and consisted of aspen forest that included clearings (average size approximately 16 ha) with sedge (Carex spp.), alfalfa (Medicago sativa), clover (Melilotus spp.), and brome (Bromus spp.). During this study, the total population consisted of 79 cows and 73 bulls, excluding calves. All individuals were marked with large ear-tags in the right ear. Ages were known for all animals. Cows ranged from 1 to 14 yr, bulls from 1 to 7 yr.
Mature bulls were removed from the experimental side, leaving 9 B1's, 14 B2's and 28 cows (> 1 yr). The control side contained 13 B1's, 17 B2's, 10 B3's, and 39 cows. This distribution resulted in 3.4 bison per km2 on the experimental side, and 3.2 bison per km2 on the control side. Fifteen experimental and 20 control cows were lactating in 1991. The sex ratio in the experimental population was in favour of cows. This was intended because we believe that this simulates the situation in any population from which mature males are removed.
The behaviours recorded
We collected data daily between May 20 and October 11, 1991. Because of our specific interest in aggressive (see sequential paper, KOMERS et al. 1994) and tending behaviour, we collected data for these variables using individual bulls as sampling units. This allowed us to analyze and present these data for shorter time periods: Time 1 and 2 represented two halves of pre-rut (20 May to 10 July), Time 3 and 4 represented the rut (11 July to 31 August), and Time 5 and 6 represented late-rut ( 1 September to 11 October). Pre-rut, rut and late-rut spanned over similar time periods as in the MBS. Behaviours other than tending and aggression were collected using the same protocol as in the MBS, in an attempt to simplify the comparison between free-ranging and captive bison. We searched the experimental and control sides on alternative days using all-terrain vehicles. Behaviour was recorded only on clearings during sessions of 1 to 8 hr. Contrary to the MBS, the bison on the ranch did not seem to alter their behaviour after being approached by a vehicle to 10 to 20 m. We therefore conducted all our observations from vehicles.
Walking and grazing was recorded following the same protocol as in the MBS. An investigation of a cow by a bull was recorded ad libitum if a bull placed his nose to within 20 cm of a cow's genitals. The hourly rate of investigations observed was calculated for each age-class as the total number of interactions divided by the number of bulls in that class and the number of cows in the group.
A tending pair was recorded when a bull stood close and parallel to a cow and followed the cow's movements closely (LOTT 1974). The pair was observed continuously to record the beginning and the end of each tending bout. We recorded an aggressive interaction for each of two interacting bulls, whenever one bull approached another to within two body lengths and either bull turned away using at least two steps. We assumed that the bull turning away was displaced by the former. This definition of aggressive interactions included "passive dominance" and "aggression" as described by McHugh (1958: 17 and 21). We agree with McHugh that "passive dominance" includes subtle interactions in which the initiator merely walks towards the recipient, which turns away without any signs of haste. "Aggression" may be observed from the same pair of interacting bulls within minutes, but may include lunging at the recipient and subsequent running away from the initiator. "Aggression" also included escalated fights (termed "battle" by McHuGH).
Some bulls lost their ear marks during the course of the study and were no longer identifiable. We calculated the average number of times unmarked bulls in each age-class were seen in mixed groups as if they were one additional individual (age-class determined as in the MBS).
Statistical analysis, data presentation, and terminology
Data from the 2 years in the MBS were combined. To insure independence of behavioural data, we adopted individual groups as the sampling units. Although some groups may have contained some of the same individuals, no two" groups were identical in their composition due to the high fluidity of groups (KOMERS et al. 1992). Almost all behavioural data sets were not normally distributed. Therefore, nonparametric statistical tests were used throughout the data analysis, except when specified otherwise. For simplicity, we refer to "invariant behaviour" as that behaviour which is relatively unaffected by the population age-structure. We do not discount the variability of that behaviour within each age-class.
Results
Reproductive behaviour in free ranging bison
Older bulls were more often solitary than younger bulls, but when they entered cow groups, older bulls were involved in more aggressive and sexual interactions and they tended more than younger ones (KOMERS et al. 1992). Increased rutting activity presumably occurs at the expense of feeding and should involve more walking. Indeed, bulls with increasing age grazed significantly less during the rut (Kruskal-Wallis, df = 3, P < 0.001) and the late-rut (P = 0.004). Bulls with increasing age walked more during the rut (P < 0.001), but walking did not differ (P > 0.05) among age-classes during other time periods. During the rut, B4's grazed less than all other age-classes (multiple comparisons, p < 0.05), while during the late-rut, there was no significant difference between B3's and B4's.
Focal individuals showed similar proportions of grazing and walking, compared to the above analysis of scans (B2 graze: n = 5, 45.2 ± 5.9%, walk: 15.8 ± 8.7%; B3 graze: n = 5,27.0 ± 13.5%, walk: 28.2 ± 7.4%). Differences between age-classes were not significant (Wilcoxon, two-sample, p > 0.20). However, four B2's spent more time grazing than walking, one spent equal time in both (Wilcoxon singed ranks, one-tailed, n = 4, T = 10, p = 0.063), while three of five B3's spent more time walking.
Comparing behaviour across time periods, the proportion of bulls found grazing decreased significantly during the rut among B4's (Kruskal-Wallis, df =3, p = 0.02) and B3's (P = 0.01) but not among B2's (P = 0.33) and B1's (P = 0.08).
The proportion of bulls found walking increased significantly during the rut among B4's (Fig. 1, Kruskal-Wallis, df = 3, p < 0.001), B3's (P < 0.001), and marginally among B2's (P = 0.036), but not among B1's (P = 0.37). When walking, bulls with increasing age walked faster during the rut, but no significant difference was evident between age-classes in the late-rut and no change between rut and late-rut was significant.
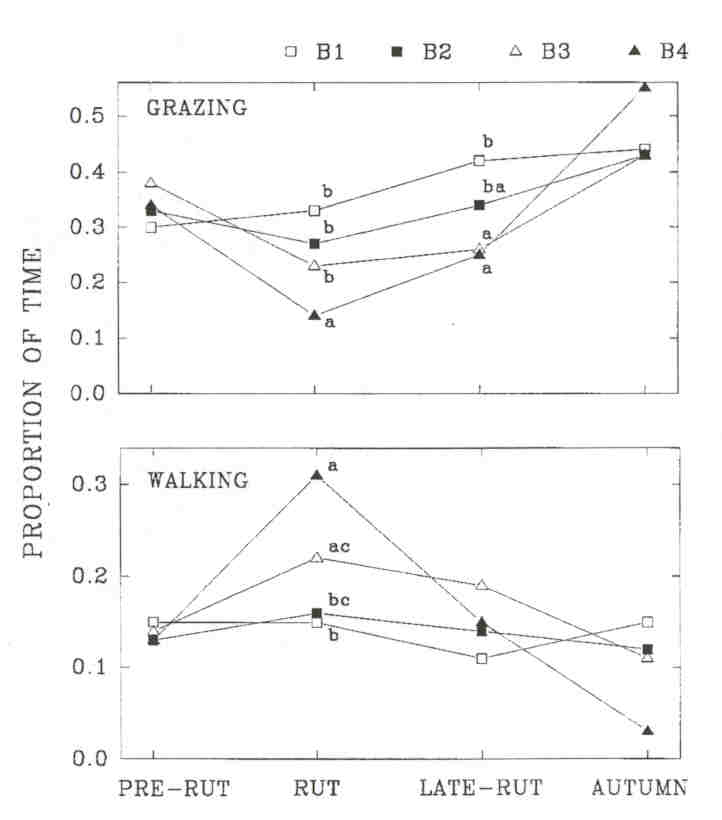
Fig. 1 - The proportion of time spent grazing and walking by wood bison bulls in four age-classes (B1 to B4) in the Mackenzie Bison Sanctuary. Results from a pairwise multiple comparison are shown for periods in which an overall significant difference was found. Entries with the same letter within a period are not significantly different (P > 0.05). Sample size is the number of mixed groups in which at least one bull of a given age-class was observed. Sample sizes for B1 to B4, respectively, were: pre-rut 47, 41, 38, 25; rut 80, 83, 89, 64; late-rut 55, 60, 71, 36; autumn 14; 13, 15, 5
Bull size in the Mackenzie Bison Sanctuary
Scrotal circumference, girth, and length increased significantly with increasing age. For all measurements, the difference was significant between B2's and B3's, and between B2's and B4's (multiple comparisons, Bonferroni t-test, p < 0.05), but there was no significant difference between B3's and B4's.
During the pre-rut, B3's had significantly more subcutaneous fat than B2's, but during the late-rut B3's had no subcutaneous fat, and had significantly less fat than B2's. (Table 4).
Table 2
Steps per minute (± SE) taken while walking by wood bison bulls in the MBS. Sample sizes are presented in parentheses. P-values are based on a one way ANOVA. Page refers to the overall difference between the three age-classes, andPtime refers to the difference between the two periods.
|
Bull |
Rut |
Late-rut |
Ptime |
|
B2 |
6.0 ± 0.6 (51) |
6.5 ± 0.8 (24) |
0.60 |
|
B3 |
7.7 ± 1.0 (41) |
5.9 ± 0.8 (24) |
0.22 |
|
B4 |
9.0 ± 0.9 (34) |
7.5 ± 1.4 (51) |
0.40 |
|
Page |
0.047 |
0.54 |
|
Table 3
Size of bulls (cm ± SE) of three age-classes (B2 to B4) measured in the MBS. Sample sizes are presented in parentheses. P- values are based on a one way ANOVA. Page refers to the overall difference between the three age-classes.
|
Bull |
Scrotal circumference |
Girth |
Length |
|
B2 |
32.4 ± 0.7 (17) |
226.7 ± 3.88 (20) |
300.1 ± 4.6 (20) |
|
B3 |
38.8 ± 0.7 (20) |
255.1 ± 3.2 (22) |
35.2 ± 3.5 (22) |
|
B4 |
40.7 ± 1.5 (5) |
261.0 ± 5.0 (5) |
333.2 ± 5.9 (5) |
|
Page |
< 0.001 |
< 0.001 |
< 0.001 |
Table 4
Depth of subcutaneous fat (mm ± SE) measured at the gluteo-biceps of wood bison bulls in the MBS. Sample sizes are presented in parentheses. P- values are based on Wilcoxon two-sample test. Page refers to the overall difference between the three age-classes. Ptime refers to the difference between the two periods.
| Bull | Pre-rut | Late-rut | Ptime |
| B2 | 1.5 ± 0.8 (10) | 2.3 ± 1.2 (7) | 0.44 |
| B3 | 7.7 ± 0.6 (11) | 0.0 ± 0.0 (9) | < 0.001 |
| Page | < 0.001 | 0.015 |
Reproductive behaviour in different social environments
Experimental B2's were found less often outside of mixed groups than control B3's during pre-rut and late-rut, but they did not differ from control B2's in their pattern of associating with cows. In fact, the trends were to associate even more with cows than control B2's. The pattern of association by control B2's was similar to those in the MBS (KOMERS et al. 1992).
The time spent grazing by control B2's and B3's was strikingly similar to the same age-classes in the MBS during both rut and late-rut. Trends were also similar in the time spent walking. By contrast, experimental B2's tended to graze less during the rut than control B2's (Kruskal-Wallis, p = 0.10), and significantly increased the time spent grazing from rut to late-rut (P = 0.007), while neither control B2's (P = 0.35) nor control B3's (P = 0.56) changed significantly. Differences between experimental and control B2's in the time spent walking were not significant in any of the three time periods. However, experimental B2's showed a trend of decreasing time spent walking from rut to late-rut, Kruskal-Wallis, p = 0.07), while control B2's did not (P = 0.21). On the control side, the trends were similar to the ones found in the MBS; older bulls tended to graze less and walk more than younger ones.
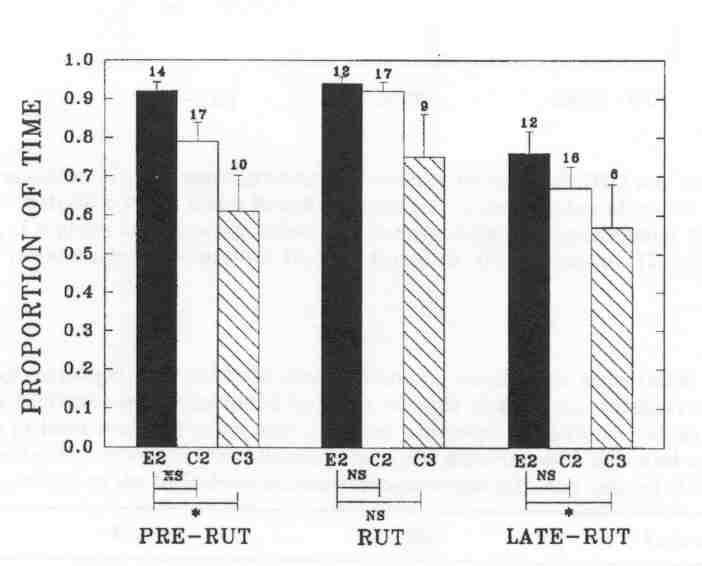
Fig. 2 - The mean proportion of time (± SE, indicated by error bars) that individual bulls were found in mixed groups at the Waterhen Wood Bison Ranch. Sample size (above the bars) is the number of individual bulls observed. The comparison between experimental B2's (E2) and control B2's (C2), and between experimental b2's and control B3's (C3), respectively, is presented under the bars (Wilcoxon two-sample test; NS: not significant; *P < 0.05).
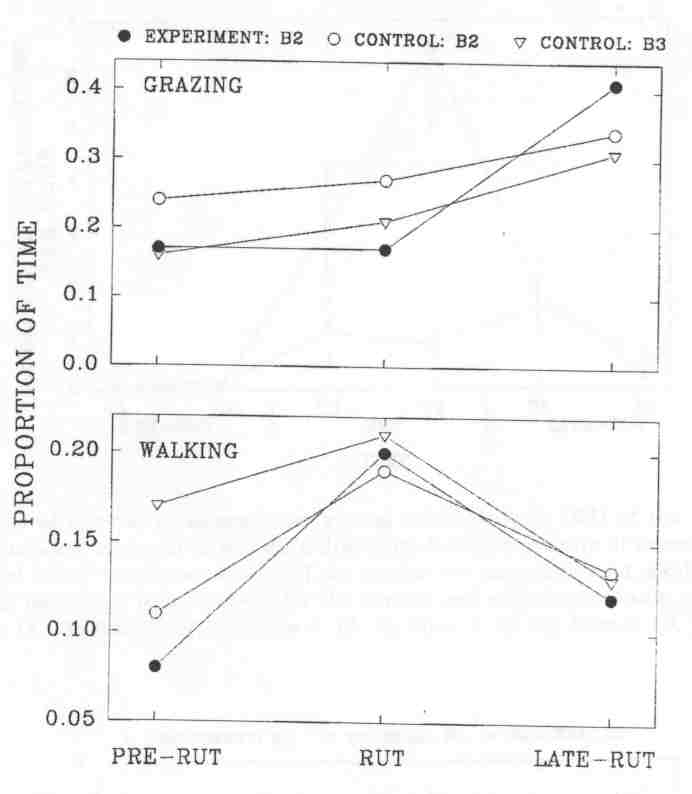
Fig. 3 - The proportion of time spent grazing and walking by subadult (B2) and mature (B3) wood bison bulls at the Waterhen Wood Bison Ranch. Sample size is the number of mixed groups in which at least one bull of a given age-class was observed. Sample sizes for experimental B2's, control B2's and control B3's, respectively, were: pre-rut, 18, 17, 14; rut, 18, 19, 18; late-rut, 17, 16, 13.
Table 5
The hourly rate of investigations (per bull) observed among wood bison bulls (B2's) at the Waterhen Ranch. (± SE) have been multiplied by 1000. Sample size (in parentheses) is the number of groups in which at least one bull of an age-class was observed. Probability values P are based on Kruskal-Wallis tests.Pe.2 refers to the difference between experimental B2's and control B3's.
|
Bull |
Pre-rut |
Rut |
Late-rut |
|
Control B2 |
2.7 ± 0.9 (17) |
5.8 ± 2.3 (19) |
28.1 ± 8.2 (17) |
|
Control B3 |
6.4 ± 3.3 (14) |
7.6 ± 2.1 (18) |
21.1 ± 6.7 (13) |
|
Experiment B2 |
5.0 ± 2.3 (18) |
13.4 ± 3.6 (18) |
44.0 ± 15.6 (17) |
|
Pe.2 |
0.48 |
0.034 |
0.82 |
|
Pe.2 |
0.75 |
0.23 |
0.26 |
As in the MBS, these changes in time budgets coincided with rutting activities. Experimental B2's were observed significantly more often to investigate cows during the rut than control B2's, but the difference was not significant from control B3's. Differences were not significant in other time periods. Experimental B2's showed a significantly higher rate of aggressive interactions during Time 4 than control B2's. The rate of aggressive interactions decreased significantly among experimental B2's from Time 4 to Time 5 (P = 0.024), but it did not change significantly among control B2's (P = 0.71). Among experimental B2's, tending occurred primarily during Time 4, at which time experimental B2'stended significantly more than control B2's. The timing of tending activity was similar between experimental B2's and control B3's. However, the social environment did not affect the average length of the tending bout of B2's, and B3's had longer tending bouts than B2's on either side. This suggests that tending B2's are more often replaced by other bulls. We investigated the number of times tending bulls were observed to be replaced by another bull on a given, day (replacements between days were not included). We compared the number of observed replacements in each age-class to the average time that bulls in each class were observed tending over the breeding season (experimental B2's: 333 min; control B2's: 119 min; control B3's: 240 min). Experimental B2's were more often replaced by other bulls (n = 67) than control B3's (n = 20, X2 = 12.8, df = 1, P < 0.001) and equally often as control B2's (n = 21, r = 0.60, df = 1, p = 0.60). Control B2's were also more often replaced than control B3's (r = 6.0, df = 1, p = 0.014).
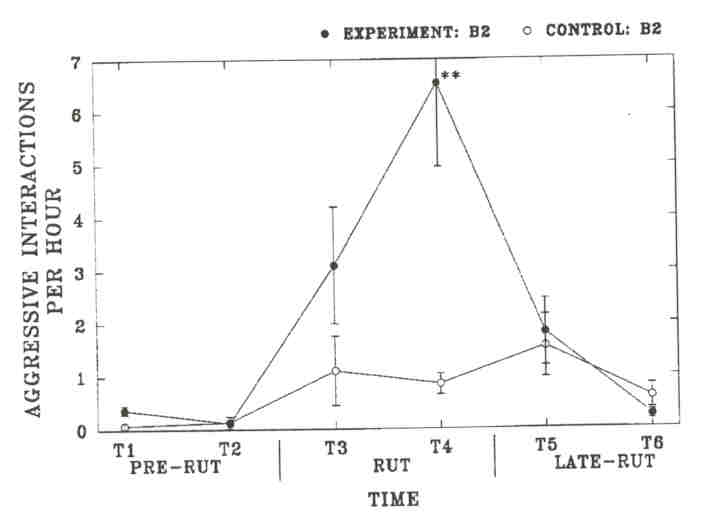
Fig. 4. - The rate of aggressive interactions among subadult bulls (B2) of the Waterhen Wood Bison Ranch. Results are analyzed to test for a difference between the rate of interactions of experimental and control B2's (** indicates P< 0.001, no symbol for non-significant results). Sample sizes are the number of individual B2's observed for the control and experimental side, respectively Time 1: 17, 14; Time 2: 14, 13; Time 3: 17, 14; Time 4: 17,13; Time 5: 16, 12; Time 6: 10,10.
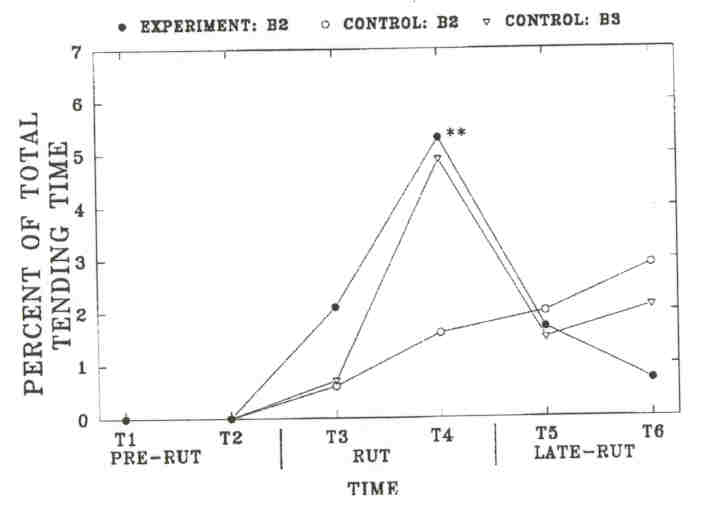
Fig 5. - Mean proportion of the "total time" (± SE, indicated by error bars) that tending was observed in individual bulls on the Wood Bison Ranch. "Total time" is the number of minutes that tending by any bull was observed on each side (experiment: 563 + min, control 3526 min). Sample size is the number of individual bulls observed tending at least once during each time period: Time 3 to 6, experiment B2, 12, 11, 9, 2; control B2, 6, 10, 9, 3; control B3, 4, 8, 4, 3. No bull tended in Time 1 and 2. Tending was significantly different only during Time 4 between experimental and control B2's (Wilcoxon two-sample test, P < 0.01, indicated by **).
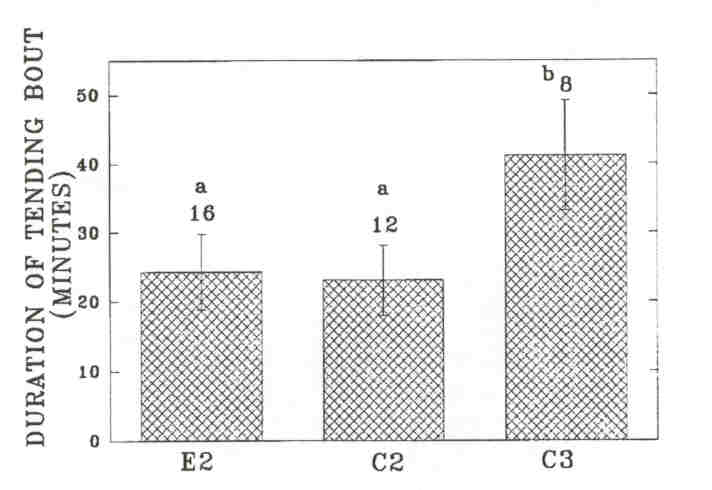
Fig 6. - Mean length of tending bouts (± SE, indicated by error bars) by individual bulls on the Wood Bison Ranch. Sample size (above the bars) is the number of individual bulls observed tending at least once during the season. Results from Wilcoxon two-sample tests are indicated by letters above the bars. Entries with the same letter are not significantly different (P > 0.05). E2: experimental B2's; C2: control B2's; C3: control B3's.
The number of mountings by B2's during which the mounted animal could be determined was 6 and 25 among control and experimental B2's, respectively. Control B2's were never observed to mount a cow, while experimental B2's mounted cows 11 times. Thus, experimental B2's mounted cows nearly significantly more often (Fisher exact, p = 0.066). In the other cases the mounted animal was a bull (young bison bulls often mount other bulls; LOTT 1983).
Discussion
Subadults were able to adjust to different social environments in four of the investigated behaviours. These included male-female interactions and the rate of aggression. The pattern of associating with cows and the duration of tending bouts including the probability of being replaced was not affected by the social environment. Finally, the time budgets for grazing and walking were adjusted by experimental subadults during the peak of the rut to resemble time budgets of adults, but were changed during the late-rut, at which time they .were even less similar to adults than those of control subadults.
Time budgets
The time budget of an animal is closely linked to its energy budget, as the time spent in gathering food is related to energy intake, while the time spent in locomotion apart from feeding is related to energy expenditure (PENNYCUICK 1979, ROBBINS 1983, MURRAY 1991). Energy reserves are often estimated by measuring fat deposits (ROBBINS 1983: 222). Most wild animals accumulate only a limited amount of fat while they are growing (ROBBINS 1983: 218). This may be a reason for the higher susceptibility of young males to starvation than that of adult males (RATTRAY 1977).
Subadult wood bison males not only had lower fat reserves before the rut, but also, because of their smaller size, they allocate more of their energy intake towards growth than mature bulls. In addition, locomotion is energetically more expensive per unit body mass for smaller than for larger animals (TAYLOR et al. 1982, PETERS 1983). Consequently, subadults would deplete their body reserves sooner than adults, if they would feed as little and walk as much as adults, potentially increasing the risk of malnutrition. Malnutrition could have immediate effects, such as the decrease of steroid levels and the resulting decrease in aggressive and sexual behaviour (MOULE 1963, BRONSON 1989). Decreased testosterone levels during malnutrition in growing males could also have adverse consequences over future reproductive seasons, especially when compensatory growth is limited (SUTTIE & HAMILTON 1983, RYG 1984), Moreover, malnutrition can have long-term effects by negatively affecting growth (CRICHTON et al. 1960, MCCANCE 1968). The limited time during which subadults in our study were able to maintain a low energy intake, may have been a manifestation of avoiding the serious implications of malnutrition.
Table 6
Behaviours relating to reproduction which were or were not adjusted by subadult wood bison males to resemble adults, when adults were absent from the population.
| Behaviour | Subadults resembling adults |
| Associating with cow groups | no |
| Time spent grazing | yes/no |
| Time spent walking | yes/no |
| Rate of Investigating cows | yes |
| Frequency of mounting cows | yes |
| Rate of aggressive interactions | yes |
| Total time tended over the season | yes |
| Length of tending bout | no |
| Frequency of being replaced from tending | no |
We conclude that the plasticity of time budgets relating to energy intake and expenditure is limited by the available body reserves, which are generally lower in subadult than mature animals. A similar relationship between time budgets and body reserves has been documented for red deer (Cervus elaphus, LUlTON-BROCK et al. 1982). For two cervid species (red deer and moose, Alces alces) it has been found that the decrease in appetite is mediated through physiological mechanisms (CLUTTON-BROCK et al. 1982, MIQUELLE 1990, and references therein), suggesting that time budgets are affected by seasonal fluctuations of hormonal levels, rather than by the social environment. Interestingly, while our subadult bison were relatively flexible in their time budgets, young reindeer (Rangifer tarandus) do not seem to adjust their time budgets to the social environment (KOJOLA 1991 ). Perhaps, these differences between bison and reindeer represent general differences between bovids and cervids, in the degree that rutting activities are mediated by hormonal levels. Both bovids and cervids show seasonal cycles in testosterone levels, but also testis size and rate of food intake ( cervids: HAIGH et al. 1984, SUTTIE & KAy 1985, bovids: LINCOLN 1989, MCCOOL & ENTWISTLE 1989). However, from these studies it is also evident that the seasonality is more pronounced in cervids than in bovids at the same latitude, with cervids showing both a shorter duration in rutting related changes than bovids and a more pronounced change in testosterone levels and sperm production, both of which are barely detectable outside of the rut (HAIGH et al. 1984 ). As a result, subadult bovids may be more flexible during the rut in allocating their breeding activity to times of lower competition by mature males. Much research is required to verify our speculations.
Other adaptable behaviours
The fact that experimental subadults spent more time tending than control B2's is not surprising, but it documents that subadults are interested in receptive females. This interest is further expressed in an increased rate of investigation of cows by experimental sub adults and a higher frequency of mounting cows. Presumably, because potential competitors do not represent a great threat, subadults in absence of mature males are involved in more aggressive interactions, while competing for females. In the second paper (KOMERS et al. 1994), we show that subadults adjust the timing of aggression to the level of competition by mature males. However, we will also show that aggressive interactions which involve high risks are relatively invariant.
Invariant behaviour
The pattern of subadults associating with cows was little affected by the age-structure of the population, and it was similar to free-ranging B2's (KOMERS et al.
1992). B2's may prefer to join groups where they are safer from predation than when alone or in small bull groups. We observed that B2's in the MBS were exceedingly more difficult to approach by observers than mature bulls (P.E. KOMERS pers. obs.). Presumably, being either solitary or in small bull groups, represents a high risk of predation. If true, control sub adults may have shown a slightly increased tendency to occur outside of cow groups because for them groups of adult bulls were available, with which they could associate.
We speculate that the length of the tending bout may be relatively invariant for one or both of the following reasons: (i) body reserves may not allow a subadult to defend a female for durations similar to adults, and (ii) subadults may be more likely to yield to an aggressor than adults, thereby avoiding the risk of injuries associated with fighting. In the following paper, we show that subadults avoid participation in risky behaviour (KOMERS et al. 1994 ). Moreover, our personal observations suggest that tending subadults leave their females at the approach by other males, as well as spontaneously, with no apparent challenge. These males then lie down or initiate a grazing bout.
Conclusions
Due to their smaller scrotal circumference subadults are less fertile than mature bulls (WILLET & OHMS 1957, HAHN et al. 1969, SCHRAMM et al. 1989). Thus, for each achieved copulation, the chance of fertilizing the cow is smaller for subadults than that of adults. Given this potential of lower benefits and higher energetic costs for each reproductive act of subadults, it is expected that selection would favour subadults that defer reproduction to social maturity and invest in somatic growth (STEARNS 1976, RUBENSTEIN 1980, KOZLOWSKI 1991, PERRINS 1991). However, we have shown that only some aspects of male bison reproductive behaviour follow an age-specific schedule, while others vary with the social environment. It is likely that behaviours which represent less cost to future reproduction would be adaptable, while costly behaviours should include limited phenotypic plasticity, because the consequence of making suboptimal decisions involving costly behaviours could affect future reproduction more than when "cheap" behaviour is involved. The threshold between costly and cheap may be represented by the difference between costs that affect future reproduction and costs that can be recovered before future reproduction (CLUTTON-BROCK 1984). A decrease in feeding effort and increased sexual behaviour could become expensive only at the point when malnutrition is imminent, while leaving cow groups or fighting may be behaviours that are too costly for subadults (KOMERS et al. 1994 ). The limits of phenotypic plasticity in reproductive behaviour could be set by energetic constraints, risk of injury, and risk of predation (see PARTRIDGE & HARVEY 1988).
We have not found, nor attempted to find answers to the questions about possible mechanisms that cause some behaviours to be adaptable to the social environment. However, we have indicated in which direction some interesting research could lead, but more importantly, we have demonstrated that some behaviours vary with the social environment while some do not. This has two important implications for studies on reproductive behaviour: (i) researchers are advised to consider potential effects of the social structure on observed behaviour, and (ii) the kinds of behaviours studied should be considered relative to the potential effects of the age-structure.
Our arguments are likely applicable to other polygynous mammals, because the relationship between nutrition and time budget seems to be rather conservative among endotherms (PETERS 1983). For example, a decreased time spent feeding and a concurrent weight or fat loss during the rut, as well as lower fat reserves among sub adults have been documented for several other artiodactyl species (CLUTTON-BROCK et al. 1982, DUNHAM & MURRAY 1982, PRINS 1988, MIQUELLE 1990). However, more empirical work is needed to understand the genetic basis of the plasticity of reproductive beh3.viour and its implications on reproductive costs (CLUTTON-BROCK 1984, REZNICK 1985, PARTRIDGE & HARVEY 1988).
Acknowledgements
We thank E.I. Komers, I. Adamczewski, M. Festa-Bianchet, H.H.T. Prins, and I. Stevenson for constructive comments on an earlier draft of this paper. E.I. Komers, S. Kutz, E.
Landry, R. Morrison (in alphabetical order) and 17 volunteers from the University of Berne, Switzerland, assisted with data collection. The generous support by the Waterhen Wood Bison Ranches Ltd is greatly appreciated. We are grateful to Art Belanger, Agriculture Canada, for lending the Scanmatic back-fat measurer. J.C. Haigh helped with capturing and measuring bison. Technical assistance was provided by L. Penner and T. Ellsworth. The research was supported by: the National Science and Engineering Research Council of Canada through a scholarship to P.E. Komers and an operational grant to F. Messier; the Government of the Northwest Territories, Canada; the endangered Species Recovery Fund co-sponsored by the Canadian Wildlife Service, the World Wildlife Fund Canada, and the National Sportsmen's Shows; the Northern Scientific Training Program; the Canadian Wildlife Foundation; the Science Institute of the Northwest Territories and the Northern Heritage Society.
References
ALTMANN I. 1974. Observational study of behaviour. Behaviour 49: 227-267.
BRONSON F.H. 1989. Mammalian reproductive biology. Chicago: University of Chicago Press.
CASWELL H. 1982. Optimal life histories and the age specific cost of reproduction. Journal of Theoretical Biology 98: 519-529.
CHARLESWORTH B. & LEON I.A. 1976. The relation of reproductive effort to age. American Naturalist 110: 449-459.
CLUTTON-BROCK T.H. 1984. Reproductive effort and terminal investment in iteroparous animals. American Naturalist 123: 212-229.
CLUTTON-BROCK T.H., GUINESS F.E. & ALBON S.D. 1982. Red deer: behaviour and ecology of two sexes. Chicago: University of Chicago Press .
CRICHTON I.A., AITKEN I.N. & BOYNE A. W. 1960. The effect of plane of nutrition during rearing on growth, production, reproduction and health of dairy cattle. II. Growth to maturity. Animal Production 2: 45-57.
DUNBAR R.I.M. 1982. Intraspecific variations in mating strategy, pp. 385-431. In: Bateson P.P.G. & Klopfer P.H., Edits. Perspectives in ethology. Vol. 5. New York: Plenum Press.
DUNHAM K.M. & MURRAY M.G. 1982. The fat reserves of impala, Aepiceros Inelampus. African Journal of Ecology 20: 81-87.
GATES C.C., LARTER N.C. & KOMERS P.E. 1991. Status and composition of the Mackenzie wood bison population in 1989. File Report No.93, Dept Renewable Resources, Government of the NW1; Yellowknife.
GEIST V. 1971. Mountain sheep: a study in behaviour and evolution. Chicago: The University of Chicago Press .
HAHN I., FOOTE R.H. & SEIDEL G.E. 1969. Testicular growth and related sperm output in dairy bulls. Journal of Animal Science 29: 41-47.
HAIGH I.C., CATES W.F., GLOVER G.I. & RAWLINGS N.C. 1984. Relationships between seasonal changes in serum testosterone concentrations, scrotal circumference and sperm morphology of male wapiti ( Cervus elaphus). Journal of Reproduction and Fertility 70: 413-418.
KIRKWOOD T.B.L. & ROSE M.R. 1991. Evolution of senescence: late survival sacrificed for reproduction, pp. 15-24. In: Harvey P.H. et al., Edits. The evolution of reproductive strategies. London: The Royal Society.
KOCK M.D. & BERGER I. 1987. Chemical immobilization of free-ranging north American bison in Badlands National Park, South Dakota. Journal of Wildlife Diseases 23: 625-633.
KOJOLA I. 1991. Influence of age on reproductive effort of male reindeer. Journal of Mammalogy 72: 208-210.
KOMERS P.E., MESSIER F. & GATES C.C. 1992. Search or relax: the case of bachelor wood bison. Behavioral Ecology and Sociobiology 31: 195-203.
KOMERS P.E., MESSIER F. & GATES C.C. 1994. Plasticity of reproductive behaviour in wood bison bulls: on risks and opportunities. Ethology Ecology & Evolution 6 (in press).
KOZLOWSKI I. 1991. Optimal energy allocation models -an alternative to the concepts of reproductive effort and cost of reproduction. Acta Oecologica 12: 11-33.
LAWS R.M. 1952. A new method of age determination for mammals. Nature 169: 972-973.
LEBOEUF B.I. 1974. Male-male competition and reproductive success in elephant seals. American Zoologist 14: 163-176.
LINCOLN G.A. 1989. Seasonal cycles in testicular activity in mouflon, Soay sheep and domesticated breed of sheep: breeding seasons modified by domestication. Zoological Journal of the Linnean Society 95: 137-147.
LOTT D.F. 1974. Sexual and aggressive behaviour of adult male American bison (Bison bison),pp. 382-394. In: Geist V. & Walther F., Edits. Behaviour in Ungulates and its relation to management. IUCN: Morges, Switzerland.
LOTT D.F., 1983. The buller syndrome in American bison bulls. Applied Animal Ethology 11 :183-186. .
MCCANCE R.A. 1968. The effect of calorie deficiencies and protein deficiencies on final weight and stature, pp. 319-328. In: McCance R.A. & Widdowson E.M., Edits. Calorie deficiencies and protein deficiencies. London: I. and A. Churchill Ltd.
MCCOOL C.I. & ENTWISTLE K.W. 1989. Reproductive function in the Australian swamp buffalo bull: age effects and seasonal effects. Theriogenology 31: 583-594.
McHugh T. 1958. Social behaviour of the American buffalo (Bison bison bison). Zoologica 43;1-40.
MIQUELLE D.G. 1990. Why don't bull moose eat during the rut? Behavioral Ecology and Sociobiology 27: 145-151.
MOULE G.R. 1963. Postpubertal nutrition and reproduction by the male. Australian Veterinary Journal 39; 299-304.
MURRAY M.G. 1991. Maximizing energy retention in grazing ruminants. Journal of Animal Ecology 60: 1029-1045.
PARTRIDGE L. & HARVEY P.H. 1988. The ecological context of life-history evolution. Science 241 :1449-1455.
PENNYCUICK C.I. 1979. Energy costs of locomotion and the concept of foraging radius, pp.164-184. In: Sinclair A.R.E. & Norton-Griffiths M., Edits. Serengeti: dynamics of an ecosystem. Chicago: University of Chicago Press.
PERRINS N. 1991. Reproductive effort, reproductive cost, and optimal allocation models: a comment on Kozlowski's paper. Acta Oecologica 12: 175-176.
PETERS R.H. 1983. The ecological implications of body size. Cambridge: Cambridge University Press.
PIANKA E.R. & PARKER W.S. 1975. Age-specific reproductive tactics. American Naturalist 109: 453-464.
PRINS H.H. T. 1988. Condition changes and choice of social environment in African buffalo bulls. Behaviour 108: 297-305.
RATTRAY P. V. 1977. Nutrition and reproductive efficiency, pp. 553-576. In: Cole H.H. & Cupps P. T., Edits. Reproduction in domestic animals, 3rd ed. New York: Acadelnic Press.
REZNICK D. 1985. Costs of reproduction: an evaluation of the empirical evidence. Oikos 44:257-267.
ROBBINS C.T. 1983. Wildlife feeding and nutrition. Orlando: Academic Press.
Rubenstein D.I. 1980. On the evolution of alternative mating strategies. pp. 65-100. In: Staddon 1.E.R., Edit. Limits to action. New York: Academic Press. RYG M. 1984. Effects of nutrition on seasonal changes in testosterone levels in young male reindeer (Rangifer tarandus tarandus). Compendium of Biology and Physiology (A) 77: 619-621.
SCHRAMM R.D., OSBORNE P.I., THAYNE W. V., WAGNER W.R. & INSKEEP E.K. 1989. Phenotypic relationships of scrotal circumference to frame size and body weight in performance tested bulls. Theriogenology 31: 495-504.
SHACKELTON D.M. 1991. Social maturation and productivity in bighorn sheep: are young males incompetent? Applied Animal Behavior Science 29: 173-184.
STEARNS S.C. 1976. Life history tactics: a review of the ideas. Quarterly Review of Biology 51:3-47.
SUTTIE J.M. & HAMILTON W.1. 1983. The effect of winter nutrition on growth of young Scottish Red deer (Cervus elaphus). Journal of Zoology, London 201: 153-159.
SUTTIE 1.M. & KAY R.N.B. 1985. Influence of plane of nutrition on plasma concentrations of prolactin and testosterone and their association with voluntary food intake in red deer stags (Cervus elaphus). Animal Reproduction Science 8: 247-258.
TAYLOR C.R., HEGLUND N.C. & MALOIY G.M. 1982. Energetics and mechanics of terrestrial locomotion. I. Metabolic energy consumption as a function of speed and body size in birds and mammals. Journal of Experimental Biology 97: 1-21.
VAN ZYLL DE 1oNG C.G. 1986. A systematic study of recent bison with particular consideration of the wood bison (Bison bison athabascae Rhoads 1898). National Museum of Canada, Natural Sciences Series 6: VIII + 69 pp. .
WILLET E.L. & OHMS 1.1. 1957. Measurement of testicular size and its relation to production of spermatozoa by bulls. Journal of Dairy Science 40: 1559-1569.